100$ identify the datasets contest
THE CONTEST IS OVER – resualts are here
Some time ago I reported the water pressure at my house connection. It was around 9 bars! Ever since I was looking for a way to monitor the water pressure and also had my eyes on monitoring flow and some water quality parameters.
A few weeks ago I took the first step and got an IO-204 Monitor and Control Module from ioBridge. The IO-204 module is a gateway to the World Wide Web connecting devices to the Internet. The module has four channels each with an analog input, digital I/O, pulse count, +5v DC Power and ground. This operation, of connection stuff to the web is called Internet Of Things (IOT). The thing can be any device, even a toaster like this guy did connecting his toaster to Twitter (also done with an IO-204 module).
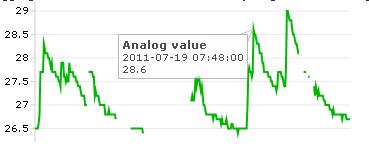
Before I can connect the thingsthat interest me to the web I had to do some learning and my first testing “project” is ready. Its somewhat ridiculous and simple but I did learn a lot from it. This small project has two sensors: one is an analog input (AI) and the other is digital (DI). The two inputs are shown, over time, in the two next on-line charts (I have made them load with a short delay to allow the full page to load first). The first is the AI showing three days of data in 12 minutes intervals. For some reason, which I could not fix, the time is shifted by two hours back (12am is actually 2am). The data logging and chart is one of the services you get from ioBridge with the IO-204 module.
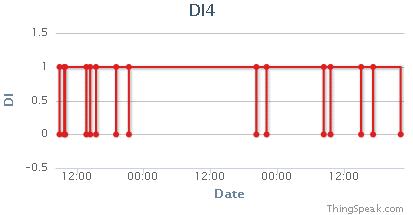
The second chart is the DI also showing three days of data but data is logged only when there is a change in the sensor’s state. For testing purposes I use a different service to plot this chart – thingspeak.com (powered by ioBridge):
About one week of AI and DI data is available in this zip file.
The contest
The first person who writes a comment to this post with the correct detailed explanation of the datasets will win 100$ US.
-
the contest will end on 30-Jun-2011 23:59.
-
payment will be made via PayPal.
- clues or answers to questions might be given from time to time on this post and will be announced on the blog’s Twitter account @watersim
- if you want to add a prize to the 100$ please contact me.
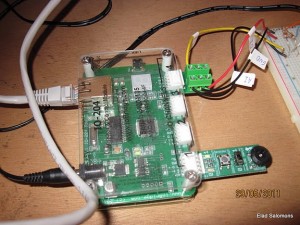
For those who are curious about the IO-204 module here are some pictures of my setup. First is the module itself with power and Ethernet connection on the left and the four channels on the right. The one on the far end is the one I used for this test.
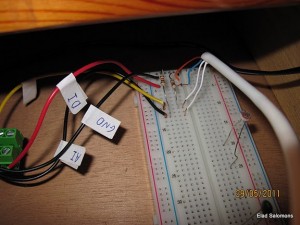
The second image is of the connections board with two 1K ohm pull-up resistor each.


I assume the two datasets are for the same ‘thing’ are they?
And are the times synchronized or does the AI dataset need to be shifted?
Great idea,
Gil
Gil,
I can’t say the two datasets are for the same ‘thing’ but they are for two sensors.
Yes, the times are synchronized in the data files.
Thanks!
This is a good idea this contest!!
So my try:
DI indicates each time you flush the toilet (0=empty, 1=full) (Observing that the event last somthing like 1 minute), no event during the night)
AI is a kind of chlorine concentration or something like this in the toilet reserve … decreising with time after a flush until the next flush
If you have not used water between 2 flush, the Chlorine Concentration continues decreasing) otherwise the chlorine rise quickly cause it’s more recent water.
Am I far ?
Jean – nice idea 🙂
However, if you want me to consider your answer you will have to explain a few things. For example:
– If the AI is chlorine concentration then what are the units?
– I thing that there are some cases were the DI changed and the AI dropped, how is that explained in your theory?
– Can you explain chlorine decay in these time intervals? Can you support it with decay constant values?
I can say with certainty that the analog input is a temperature sensor measuring in degrees C. A temperature of 25C is room temperature and the data seems to be tracking to an average of about 24.5C. I’m still struggling to think of what gets clocked by a digital signal every 12 minutes, though. My best guess right now is that this is a thermostat or maybe smoke alarm.
Luke – its the AI that is being logged every 12 minutes. The DI is logged “on change”.
Clearly the AI is the room temperature, as Luke suggested. I suggest the DI is the Air Conditioning On/Off switch. You seem to have it on all night(!) and the temperature spikes when it is turned off…
The fast response of the temperature to the turning off of the DI is actually a weakness of my theory, but careers have been built on less…
I think the information is water pressure and the second in/out information is zone valves in a watering system(the times on and off). If this is true the supply line(or pump is to small and as the pressure tank draws down the supply line flow restriction or pump flow causes the pressure drop and is evident by the pressure readings
Gil – might be but don’t forget this is a water relate blog 🙂
Wayne – nice idea. How would you explain the occasional “pressure” sudden drops?
In a few months ago, I had to analyse data with a similar profile.
I think that the analogue information is water pressure and the digital is start/stop of a pumping station, in a pressurized system with small leaks. These leaks implicates the pressure to drop when the pump is turned off for a while (with the value 1).
When the pump turned on, the pressure rises again.
This is my guess: AI is measuring water temperature in the water heater tank(Every 12 minutes). Water temperature goes down with time, but when it reaches a certain preset down value, the temperature valve starts up the heater (detected by the DI sensor)and water temperature rises again to start a new cycle.
I know the contest is ended now. But i want to precise my final guess:
the AI is chloàrine concentration in a swimming pool (in ppm) and the DI would be a a pump injecting chlore!
So we want to know the correct answer, now!!